In the Grand Ceremonial Hall of the University of Copenhagen, a splendid Nordic classical space overlooking the Church of our Lady in the heart of the old city, rows of repellent, blue plastic chairs surrounded the podium from which no less a personage than Dr. Rajendra Pachauri, chairman of the IPCC, was to speak.
I had arrived in good time to take my seat among the dignitaries in the front row. Rapidly, the room filled with enthusiastic Greenies and enviro-zombs waiting to hear the latest from ye Holy Bookes of Ipecac, yea verily.
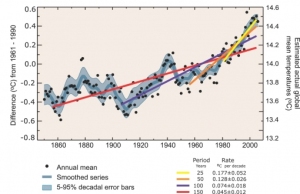
The official party shambled in and perched on the blue plastic chairs next to me. Pachauri was just a couple of seats away, so I gave him a letter from me and Senator Fielding of Australia, pointing out that the headline graph in the IPCC’s 2007 report, purporting to show that the rate of warming over the past 150 years had itself accelerated, was fraudulent.
Would he use the bogus graph in his lecture? I had seen him do so when he received an honorary doctorate from the University of New South Wales. I watched and waited.
Sure enough, he used the bogus graph. I decided to wait until he had finished, and ask a question then.
Pachauri then produced the now wearisome list of lies, fibs, fabrications and exaggerations that comprise the entire case for alarm about “global warmingâ€. He delivered it in a tired, unenthusiastic voice, knowing that a growing majority of the world’s peoples – particularly in those countries where comment is free – no longer believe a word the IPCC says.
They are right not to believe. Science is not a belief system. But here is what Pachauri invited the audience in Copenhagen to believe.
1. Pachauri asked us to believe that the IPCC’s documents were “peer-reviewedâ€. Then he revealed the truth by saying that it was the authors of the IPCC’s climate assessments who decided whether the reviewers’ comments were acceptable. That – whatever else it is – is not peer review.
2. Pachauri said that greenhouse gases had increased by 70% between 1970 and 2004. This figure was simply nonsense. I have seen this technique used time and again by climate liars. They insert an outrageous statement early in their presentations, see whether anyone reacts and, if no one reacts, they know they will get away with the rest of the lies. I did my best not to react. I wanted to hear, and write down, the rest of the lies.
3. Next came the bogus graph, which is featured three times, large and in full color, in the IPCC’s 2007 climate assessment report. The graph is bogus not only because it relies on the made-up data from the Climate Research Unit at the University of East Anglia but also because it is overlain by four separate trend-lines, each with a start-date carefully selected to give the entirely false impression that the rate of warming over the past 150 years has itself been accelerating, especially between 1975 and 1998. The truth, however – neatly obscured by an ingenious rescaling of the graph and the superimposition of the four bogus trend lines on it – is that from 1860-1880 and again from 1910-1940 the warming rate was exactly the same as the warming rate from 1975-1998
4. Pachauri said that there had been an “acceleration†in sea-level rise from 1993. He did not say, however, that in 1993 the method of measuring sea-level rise had switched from tide-gages to satellite altimetry against a reference geoid. The apparent increase in the rate of sea-level rise is purely an artefact of this change in the method of measurement.
5. Pachauri said that Arctic temperatures would rise twice as fast as global temperatures over the next 100 years. However, he failed to point out that the Arctic was actually 1-2 Celsius degrees warmer than the present in the 1930s and early 1940s. It has become substantially cooler than it was then.
6. Pachauri said the frequency of heavy rainfall had increased. The evidence for this proposition is largely anecdotal. Since there has been no statistically-significant “global warming†for 15 years, there is no reason to suppose that any increased rainfall in recent years is attributable to “global warmingâ€.
7. Pachauri said that the proportion of tropical cyclones that are high-intensity storms has increased in the past three decades. However, he was very careful not to point out that the total number of intense tropical cyclones has actually fallen sharply throughout the period.
8. Pachauri said that the activity of intense Atlantic hurricanes had increased since 1970. This is simply not true, but it appears to be true if – as one very bad scientific paper in 2006 did – one takes the data back only as far as that year. Take the data over the whole century, as one should, and no trend whatsoever is evident. Here, Pachauri is again using the same statistical dodge he used with the UN’s bogus “warming-is-getting-worse†graph: he is choosing a short run of data and picking his start-date with care so as falsely to show a trend that, over a longer period, is not significant.
9. Pachauri said small islands like the Maldives were vulnerable to sea-level rise. Not if they’re made of coral, which is more than capable of outgrowing any sea-level rise. Besides, as Professor Morner has established, sea level in the Maldives is no higher now than it was 1250 years ago, and has not risen for half a century.
10. Pachauri said that if the ice-sheets of Greenland or West Antarctica were to melt there would be “meters of sea-level riseâ€. Yes, but his own climate panel has said that that could not happen for thousands of years, and only then if global mean surface temperatures stayed at least 2 C (3.5 F) warmer than today’s.


Comments are closed.